KQL – The Kusto Query Language
The Kusto Query Language, commonly known as KQL, is a powerful query language designed for interaction with Azure Data Explorer (ADX) service. This service stands out as a rapid and scalable platform for exploring and analyzing vast datasets. Microsoft initially crafted KQL for internal use, aiming to sift through enormous data volumes from diverse sources. Later, they made it available to the public through the Azure Data Explorer service.
Features and Capabilities of KQL
KQL boasts a rich syntax, allowing users to execute advanced queries on extensive datasets. It employs a myriad of operators, functions, and data types. Users can work with numerous data types such as numeric, boolean, string, DateTime, and dynamic types. Moreover, KQL is versatile enough to handle both structured and unstructured data.
Furthermore, KQL offers a robust set of aggregation functions. These include count, sum, min, max, and percentile, facilitating intricate data analysis tasks. Additionally, it encompasses advanced features like time-series analysis, machine learning, and geospatial analysis.
Popularity and Use Cases
Due to its flexibility, scalability, and user-friendliness, KQL has become a favorite among data analysts, data scientists, and developers. They predominantly use it for log analysis, security analysis, application performance monitoring, and business intelligence.
Kusto Engine and Its Applications
Interestingly, the Kusto engine is another query language innovation by Microsoft. I engage with it regularly, especially for Azure Monitor log queries. This article narrows its focus to Azure Log Analytics.
KQL seamlessly integrates with various platforms and services, including:
- Azure Log Analytics
- Azure Application Insights
- Windows Defender ATP
- Azure Security Center
- Machine Learning
Microsoft provides a sandbox environment you can practice on, and it is free and available to everyone, and all you need is an Azure Account. https://portal.loganalytics.io/demo#
(Update1: Sadly, Microsoft has retired the portal)
(Update 2: It’s back! check out this direct link)
While I won’t delve into the basics of Log Analytics, I will, however, make notes about what some of the features mean and do

Here are some of my favorite KQL queries:
Check Free Disk Space With KQL
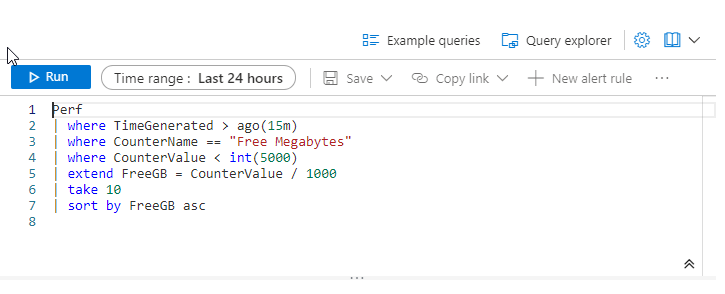
Perf
| where TimeGenerated > ago(1m)
| where CounterName == "Free Megabytes"
| where CounterValue < int(5000)
| extend FreeGB = CounterValue / 1000
| sort by FreeGB asc This KQL query is designed to search for performance metrics related to the available free memory on a system. Let’s break down the query:
- The first line filters the results only to show data generated in the past 1 minute.
- The second line filters the results only to include the “Free Megabytes” performance counter.
- The third line further filters the results only to include records where the value of the “Free Megabytes” counter is less than 5000.
- The fourth line extends the query by creating a new column called “FreeGB” that calculates the value of the “Free Megabytes” counter divided by 1000. This is done to convert the value to gigabytes for easier readability.
- The final line sorts the results by the “FreeGB” column in ascending order, showing the records with the lowest available memory first.
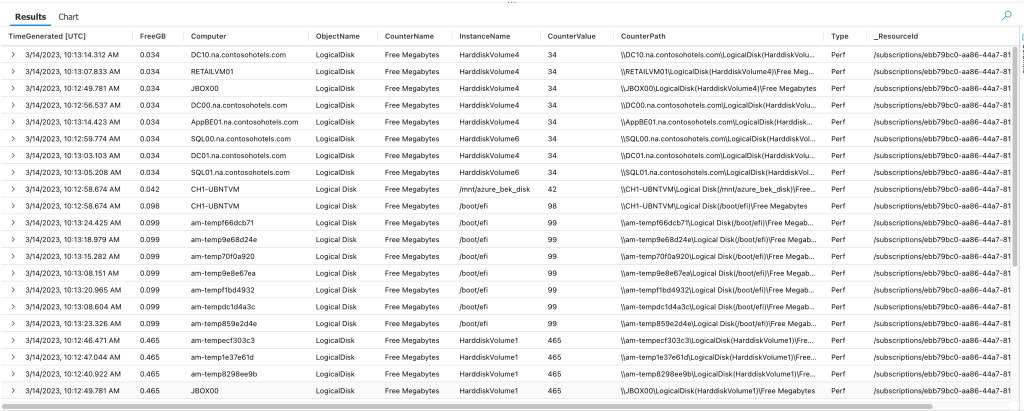
Example Output:

Node Down Alert
Heartbeat
| where TimeGenerated > ago(24h)
| summarize LastHeartbeat = max(TimeGenerated) by Computer
| where isnotempty(Computer) and LastHeartbeat < ago(12h)
| order by LastHeartbeat asc This KQL query is designed to identify systems that have not sent a heartbeat signal in the last 12 hours. Let’s break down the query:
- The first line filters the results only to show data generated in the past 24 hours.
- The second line uses the “summarize” operator to group the data by computer and find each computer’s maximum “TimeGenerated” value. This effectively finds the last time each computer sent a heartbeat signal.
- The third line filters the results only to include records where the “Computer” field is not empty, and the “LastHeartbeat” value is more than 12 hours ago.
- The final line orders the results by the “LastHeartbeat” value in ascending order so that the systems that have been offline the longest are shown first.
Servers manually rebooted by a user in the last 24 hours (Windows)
Event
| where Event contains "shutdown"
| where Source == "User32" and EventID == 1074
| order by TimeGenerated desc
| project TimeGenerated, Computer
This KQL query searches for shutdown events in the Windows Event Log. Let’s break down the query:
- The first line searches for ” shutdown ” events in the “Event” field.
- The second line filters the results only to include events from the “System” event log.
- The third line filters the results only to include events with a source of “User32” and an EventID of 1074. These are specific values that correspond to a user-initiated shutdown event.
- The fifth line sorts the results by the “TimeGenerated” field in descending order, showing the most recent events first.
- The final line projects the “TimeGenerated” and “Computer” fields, which are the timestamp of the event and the computer on which the event occurred, respectively.
Server Unexpected Shutdowns last 24 hours (Windows)
search in (Event) "shutdown" and EventLog == "System" and EventID == 6008| sort by TimeGenerated desc | project TimeGenerated, ComputerThis KQL query searches for unexpected shutdown events in the Windows Event Log. Let’s break down the query:
- The first line searches for ” shutdown ” events in the “Event” field.
- The second line filters the results only to include events from the “System” event log.
- The third line filters the results only to include events with an EventID of 6008. This EventID is associated with unexpected shutdown events, which may indicate a system crash or other issues.
- The fourth line sorts the results by the “TimeGenerated” field in descending order, showing the most recent events first.
- The final line projects the “TimeGenerated” and “Computer” fields, which are the timestamp of the event and the computer on which the event occurred, respectively.
Windows Services Stopped in the last 1 hour (Windows)
Event
| where EventID == 7036
| project RenderedDescription , Computer , EventID , TimeGenerated
| where RenderedDescription contains "stopped"
| project Computer , TimeGenerated , RenderedDescription
| sort by TimeGenerated desc
| where TimeGenerated >= ago(1h)This KQL query searches for Windows events with an EventID of 7036 and a description containing the word “stopped”. Let’s break down the query:
- The first line filters the results only to include events with an EventID of 7036.
- The second line projects the “RenderedDescription”, “Computer”, “EventID”, and “TimeGenerated” fields. This ensures that only the relevant fields are shown in the output.
- The third line filters the results only to include events where the “RenderedDescription” field contains the word “stopped”.
- The fourth line projects the “Computer”, “TimeGenerated”, and “RenderedDescription” fields. This further refines the output only to show the relevant fields.
- The fifth line first sorts the results by the “TimeGenerated” field in descending order, showing the most recent events.
- The final line filters the results only to include events generated in the past hour.
Number of User Accounts Locked out
SecurityEvent
| where Activity contains "4740"
| count This is a KQL query that counts the number of Security events that contain the string “4740” in the “Activity” field.
The “4740” string typically refers to a specific Event ID in the Windows Security event log that indicates a user account was locked out. The query will count all the events that contain this string in the “Activity” field, which may include multiple events for the same user account if it was locked out multiple times.
Note: You need to enable at least a minimum of Azure Security Events data collection for this to work. Click here for more info.
Users Locked Out
SecurityEvent
| where Activity contains "4740"
| project TimeGenerated, Account, Computer, ActivityThis is a KQL query that searches for Security events that contain the string “4740” in the “Activity” field, and projects the “TimeGenerated”, “Account”, “Computer”, and “Activity” fields in the output.
The “4740” string typically refers to a specific Event ID in the Windows Security event log that indicates a user account was locked out. By projecting the “TimeGenerated”, “Account”, “Computer”, and “Activity” fields, the query will show the timestamp of each event, the name of the locked out account, the computer where the lockout occurred, and the description of the event.
Summary
KQL (Kusto Query Language) is a query language used to query large amounts of data quickly and efficiently. Microsoft created it for their Azure Log Analytics service, and it is used in several other Microsoft products like Azure Data Explorer, Azure Sentinel, and Azure Monitor.
KQL has a SQL-like syntax and provides a rich set of operators and functions for data manipulation, aggregation, filtering, and visualization. It also supports time-series analysis, pattern matching, and machine-learning algorithms.
KQL is designed to work with structured, semi-structured, and unstructured data and can handle a variety of data sources like logs, metrics, and events. It uses a distributed computing architecture to process queries on large-scale data sets and can provide real-time insights and analytics.
Overall, KQL is a powerful and versatile language that can be used for various data analysis and monitoring tasks, making it a popular choice for cloud-based data platforms and services.


Recent Comments