
Archive
Author: Richard Bailey
-
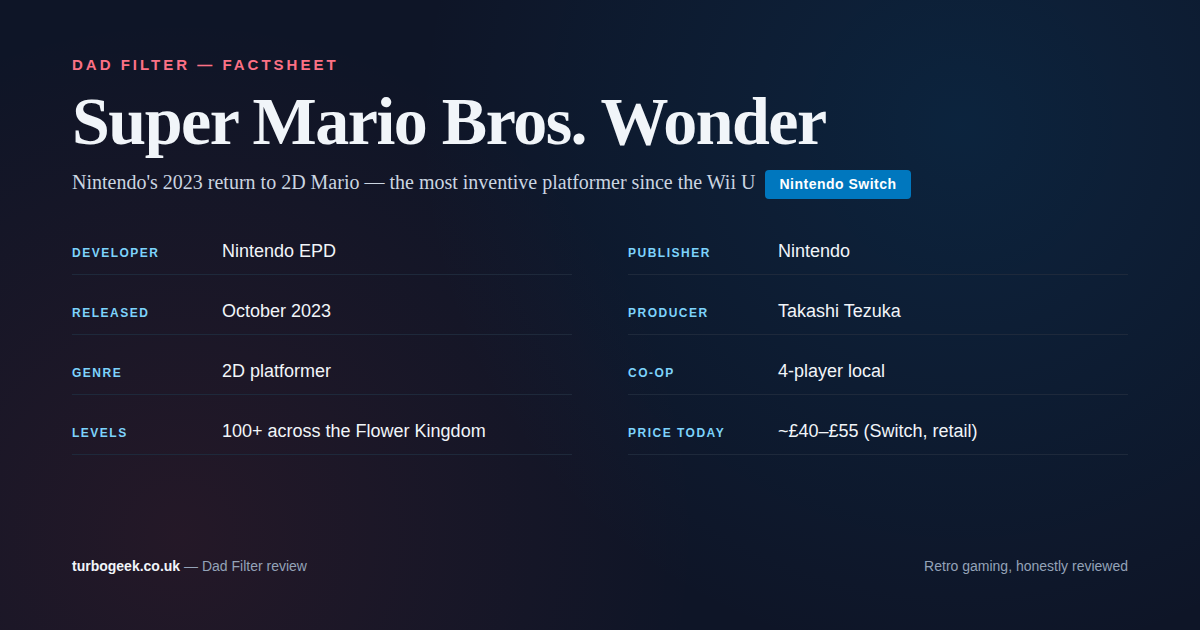
Super Mario Bros. Wonder (Switch, 2023): A Dad’s Family-Game Review
Nintendo’s 2023 return to 2D Mario. 100+ levels of Wonder Flowers, four-player co-op, and the most consistently inventive platformer Nintendo has made in years. Verdict: Buy. Read the guide
-
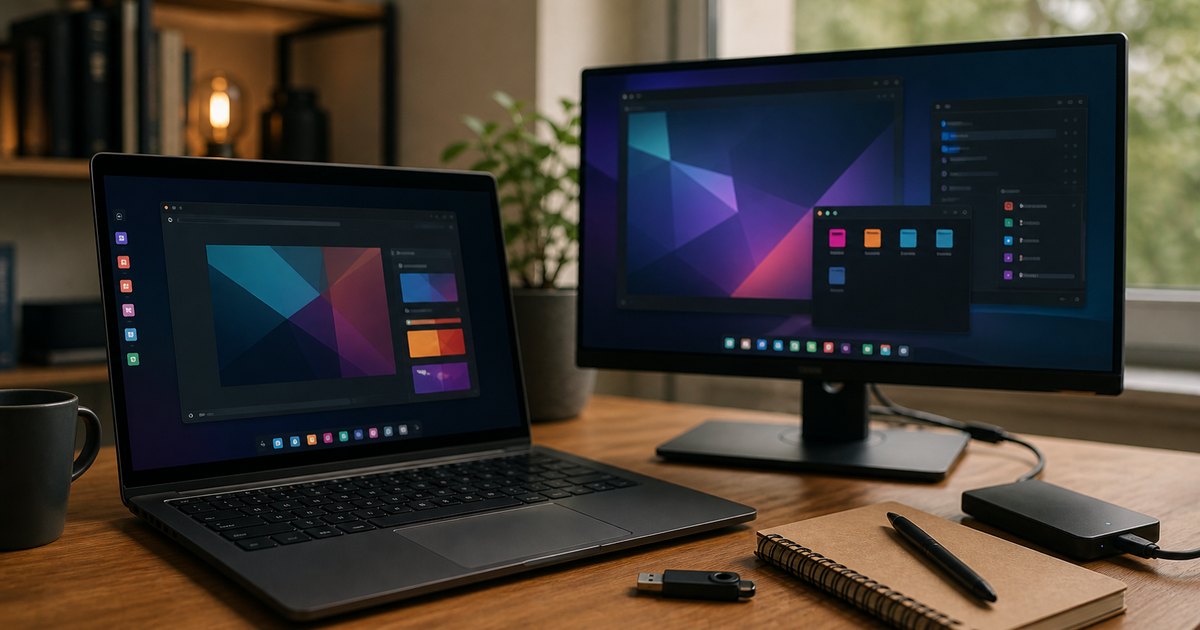
Ubuntu Core Desktop in 2026: Why Canonical Keeps Building Toward It
Canonical’s Ubuntu 26.04 desktop roadmap explicitly says the cycle lays groundwork for Ubuntu Core Desktop. Here is what that really means, where it fits, and why the company… Read the guide
-
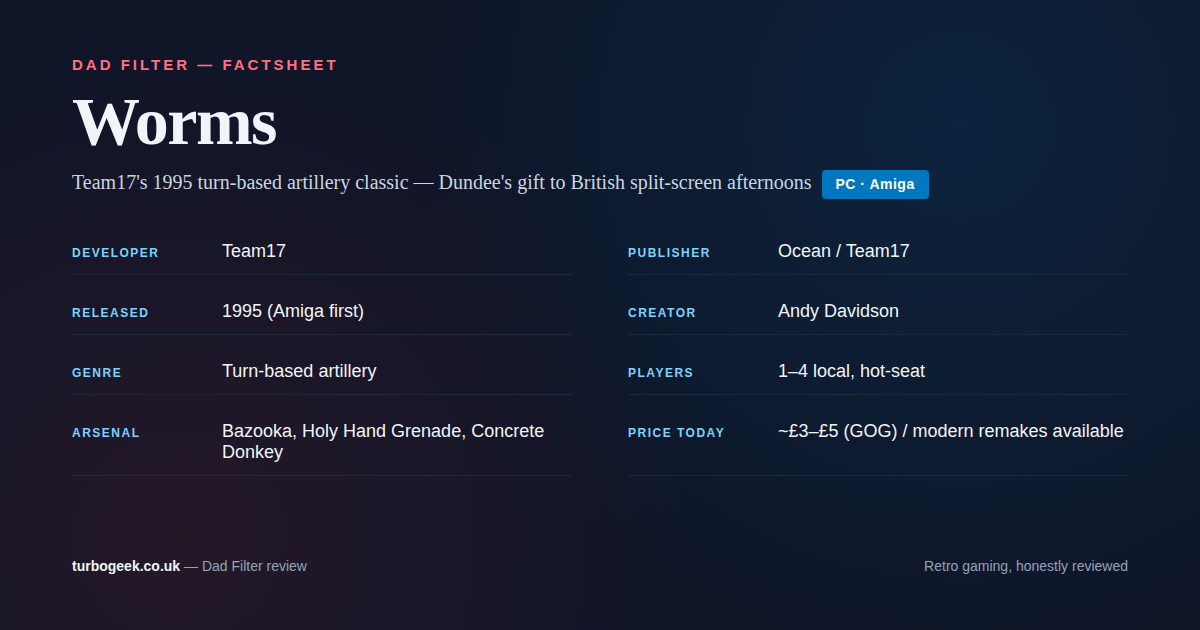
Worms on PC (1995): A Dad’s Return to Team17’s Turn-Based Artillery
Revisiting Team17’s 1995 Worms on PC. Andy Davidson’s bedroom-coded classic, the hot-seat artillery game that still plays as well as anything on the shelf. Read the guide
-

CrackArmor and AppArmor Fixes: What Ubuntu Admins Should Check
Canonical published its AppArmor vulnerability guidance on March 12, 2026. The practical message is simple: install both kernel and userspace updates, then verify your confinement story instead of… Read the guide
-
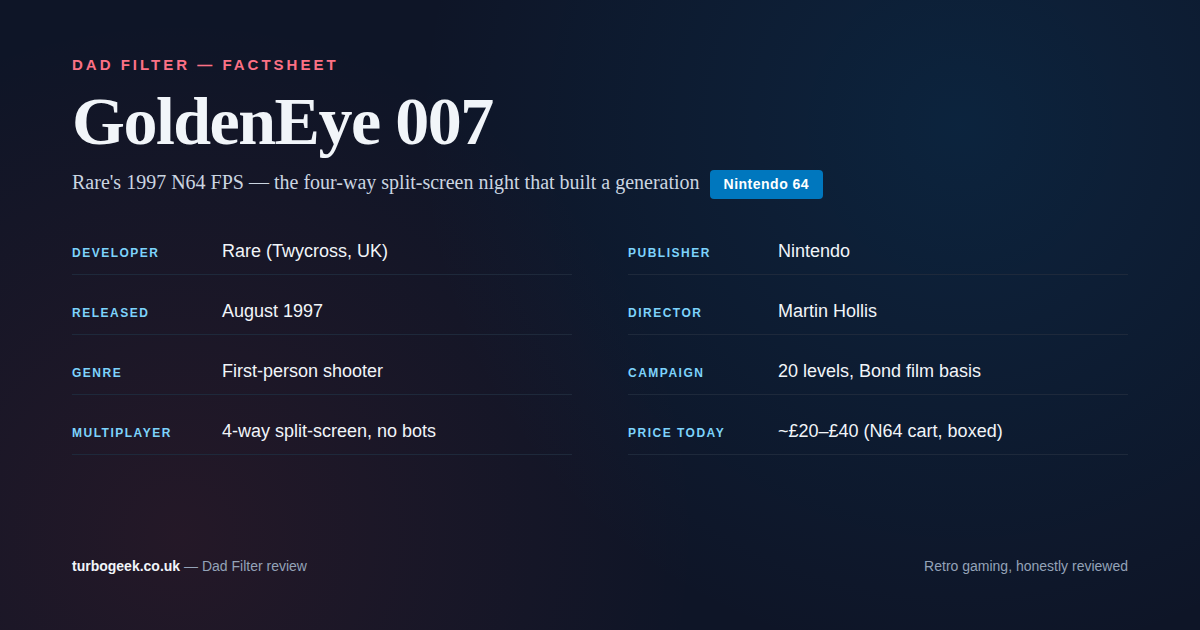
GoldenEye 007 on N64 (1997): A Dad’s Return to the Split-Screen Classic
Revisiting Rare’s 1997 N64 FPS. Nine people made it. Twenty-eight years later, four-way split-screen GoldenEye is still one of the best family gaming nights you can construct. Read the guide
-
Real-time Ubuntu Is Free in 26.04: Who Should Actually Use It?
Canonical now says the real-time kernel is freely available from Ubuntu 26.04 onwards. That changes access, not the fact that most Linux users still do not need a… Read the guide
-
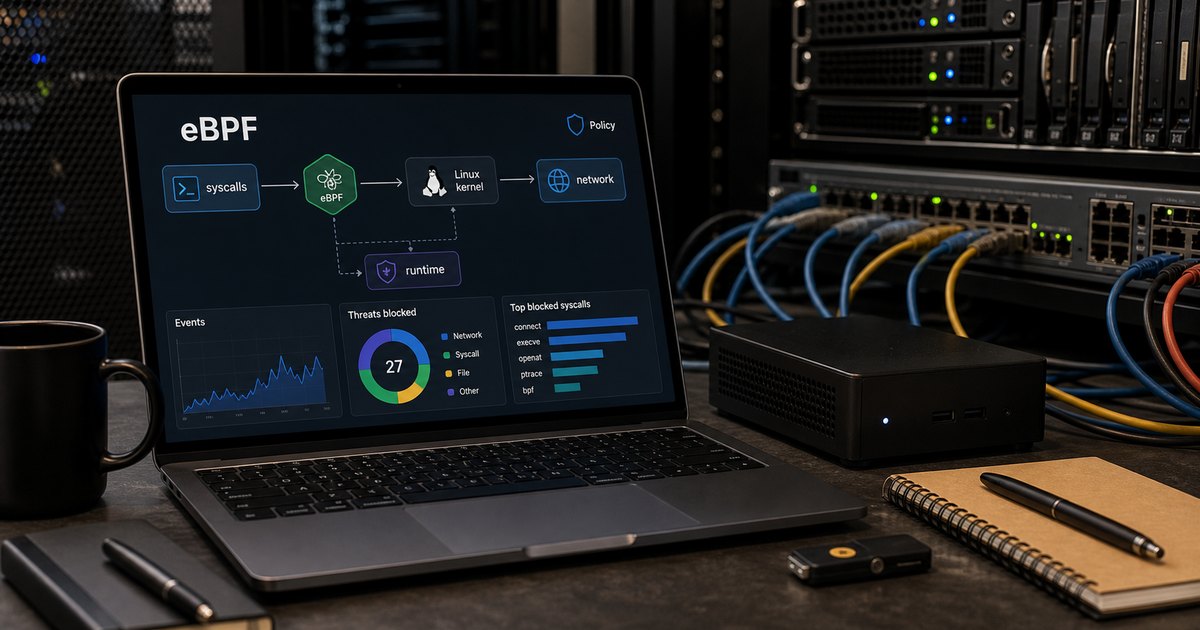
eBPF Security Policies on Linux: Dynamic Kernel Security Without Recompiles
TL;DR New to Linux kernel security? Start with the What Is eBPF? section below, then jump to Getting Started for hands-on steps. Topic When to Use Key Tool… Read the guide
-
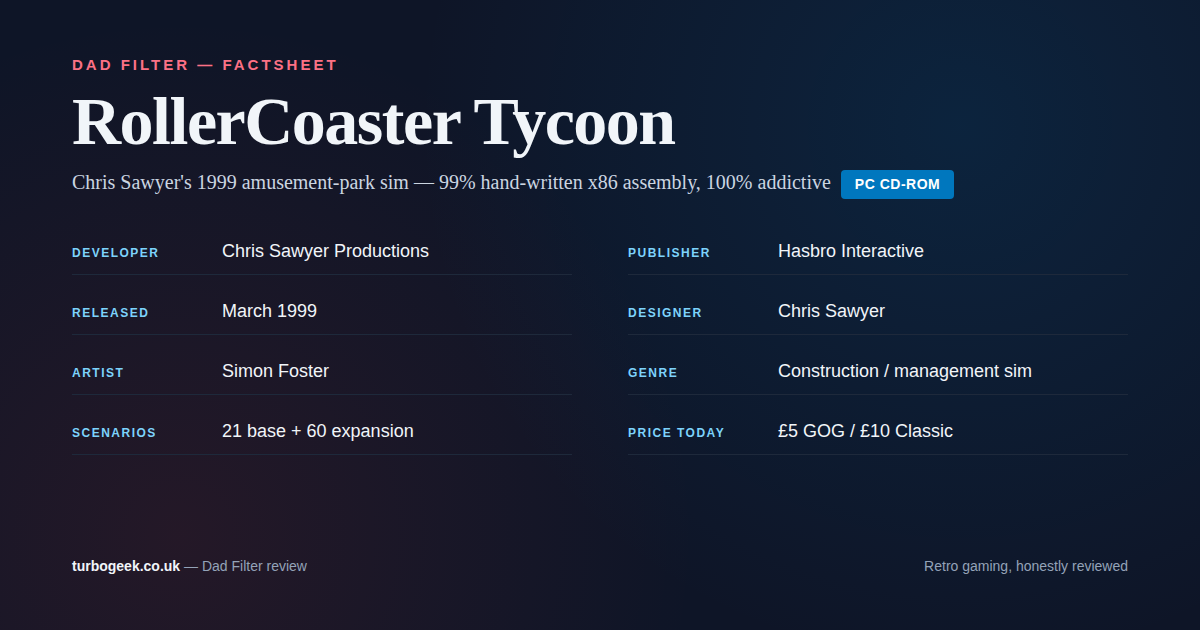
RollerCoaster Tycoon (PC, 1999): A Dad’s Return to the Best Sim of Its Era
Revisiting Chris Sawyer’s 1999 PC masterpiece. 99% hand-written x86 assembly, 4+ million copies sold, and still one of the best management games ever made. Read the guide
-
Pop!_OS 24.04 LTS Upgrade: Should You Jump to COSMIC?
System76 shipped the Pop!_OS 24.04 LTS upgrade on March 3, 2026. The real question is not whether COSMIC is interesting. It is whether you want your desktop to… Read the guide
-
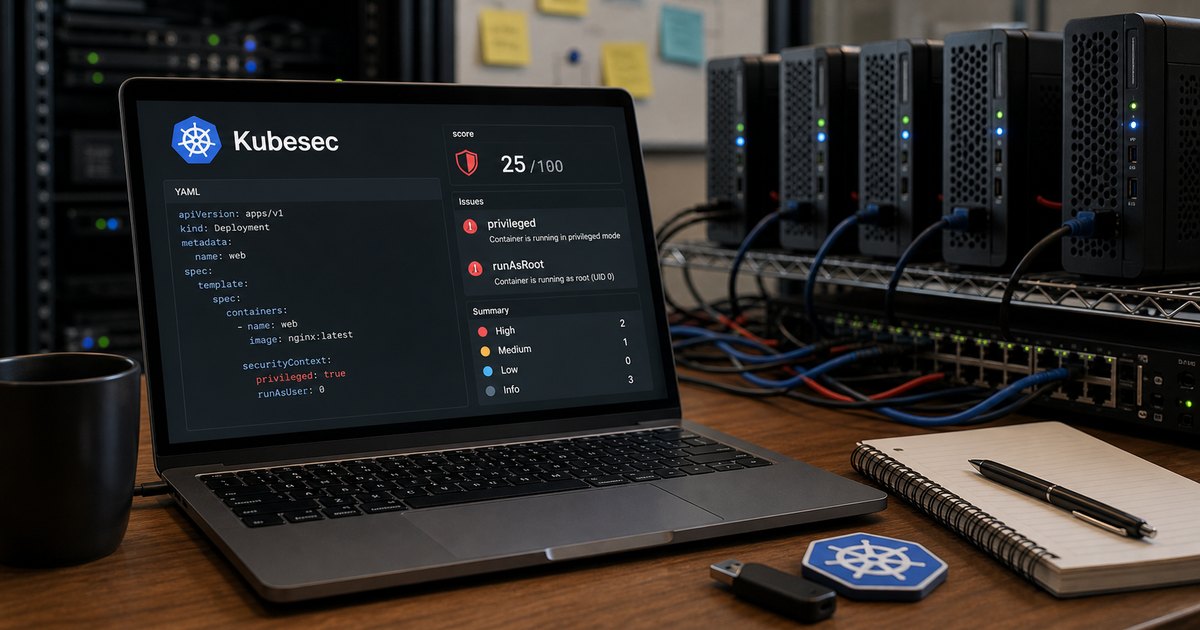
Scan Kubernetes YAML With Kubesec Before Deployment
Run Kubesec against Kubernetes manifests, understand its findings, fix risky securityContext defaults, and add a sensible CI gate. Read the guide