
Archive
Author: Richard Bailey
-

How I Give Claude Code the Right AWS Permissions
I built aws-sso-login to give Claude Code the right AWS profile for each task—read-only, DevOps or admin—using IAM Identity Center instead of long-lived keys. Read the guide
-

Leading AI Tools for Local Development Environments: Code Assistants and AI IDEs Compared
AI coding tools are now built directly into local development workflows, from GitHub Copilot and JetBrains AI Assistant to AI-native IDEs like Cursor and Windsurf. This guide compares… Read the guide
-

How to Automatically Extract Completed Downloads in qBittorrent
Tired of manually unpacking every completed download? This guide shows you how to make qBittorrent automatically extract RAR, ZIP and 7Z archives using 7-Zip, while keeping the original… Read the guide
-
Ultimate Windows 11 AI Setup: Claude, Codex, Cursor and WSL2
Set up Windows 11 for AI-assisted development with WSL2, GPU checks, Claude Code, Codex CLI, Cursor, Obsidian, claude-mem, skills and MCP servers. Read the guide
-
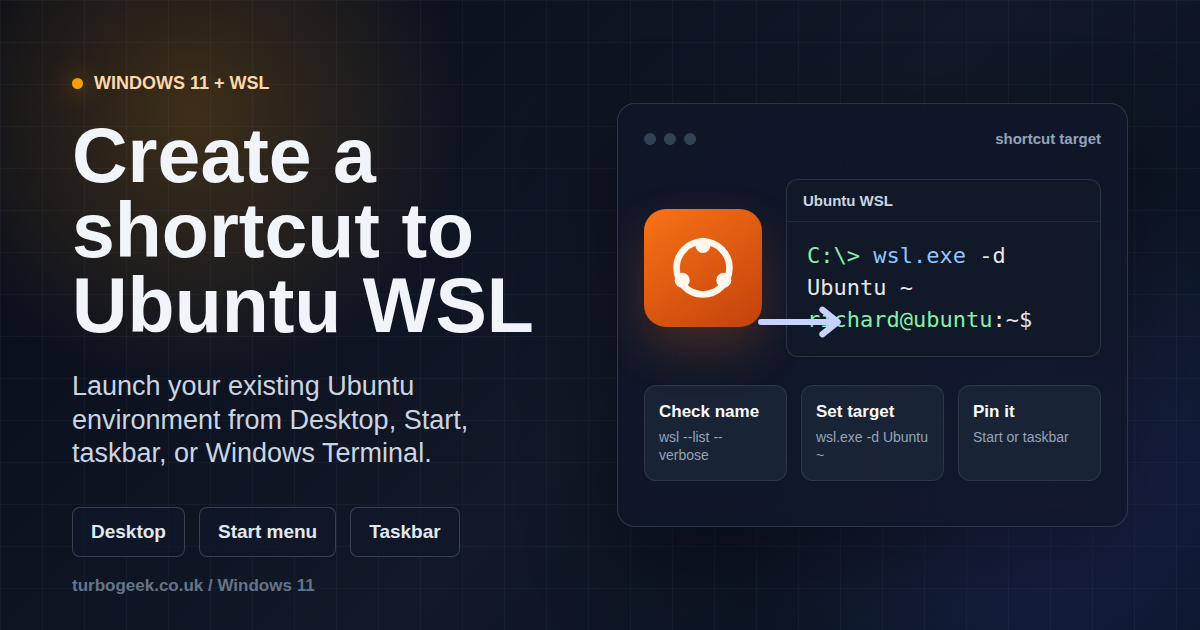
How to Create a Shortcut to Ubuntu WSL on Windows 11
Create a desktop, Start menu, or taskbar shortcut that launches your existing Ubuntu WSL installation on Windows 11. Read the guide
-
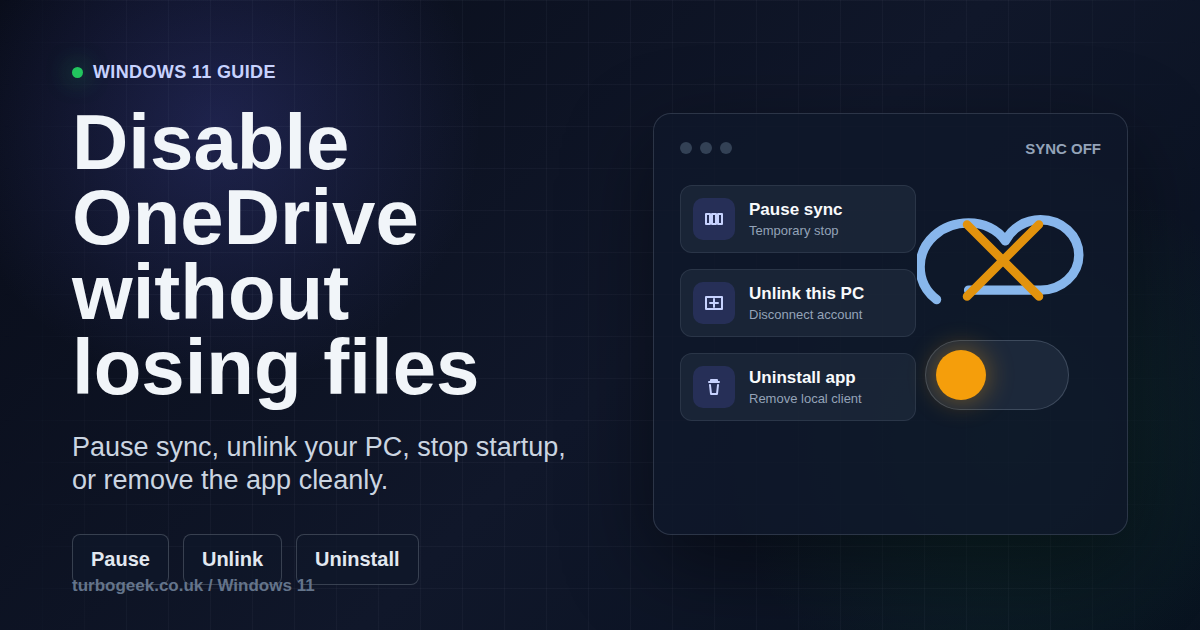
How to Disable and Uninstall OneDrive on Windows 11
Stop OneDrive from syncing, unlink your PC safely, or remove OneDrive from Windows 11 without losing files. Read the guide
-
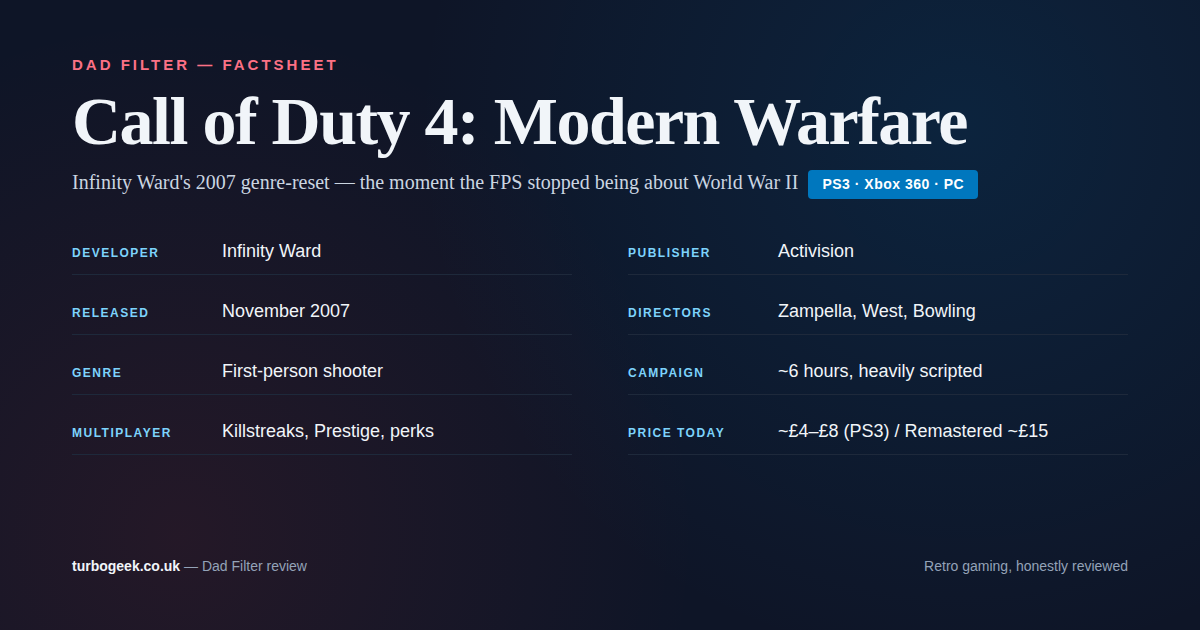
Call of Duty 4 PS3 Review: A Dad’s Epic Return
Revisiting Infinity Ward’s 2007 Call of Duty 4 on PS3. The campaign that reset the entire FPS genre, still a masterclass in scripted setpiece design. Read the guide
-
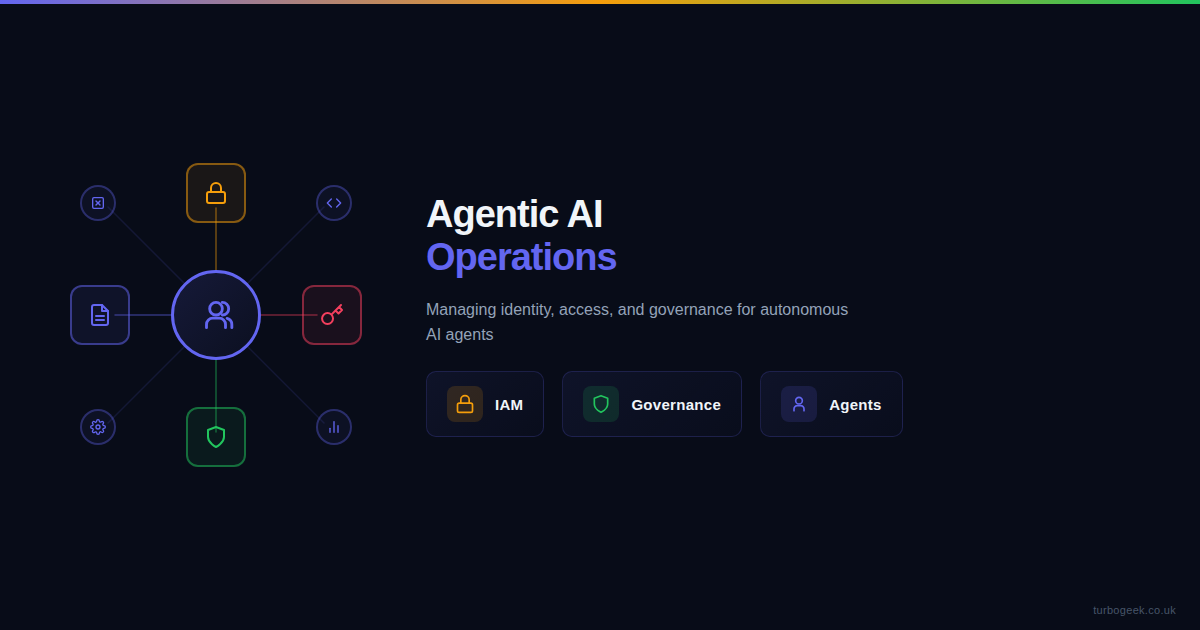
The Agentic AI Operations Guide: Identity, Access, and Governance
AI agents are no longer experimental curiosities. In 2026, autonomous AI agents are writing code, deploying infrastructure, managing databases, and interacting with production systems via tool protocols such… Read the guide
-
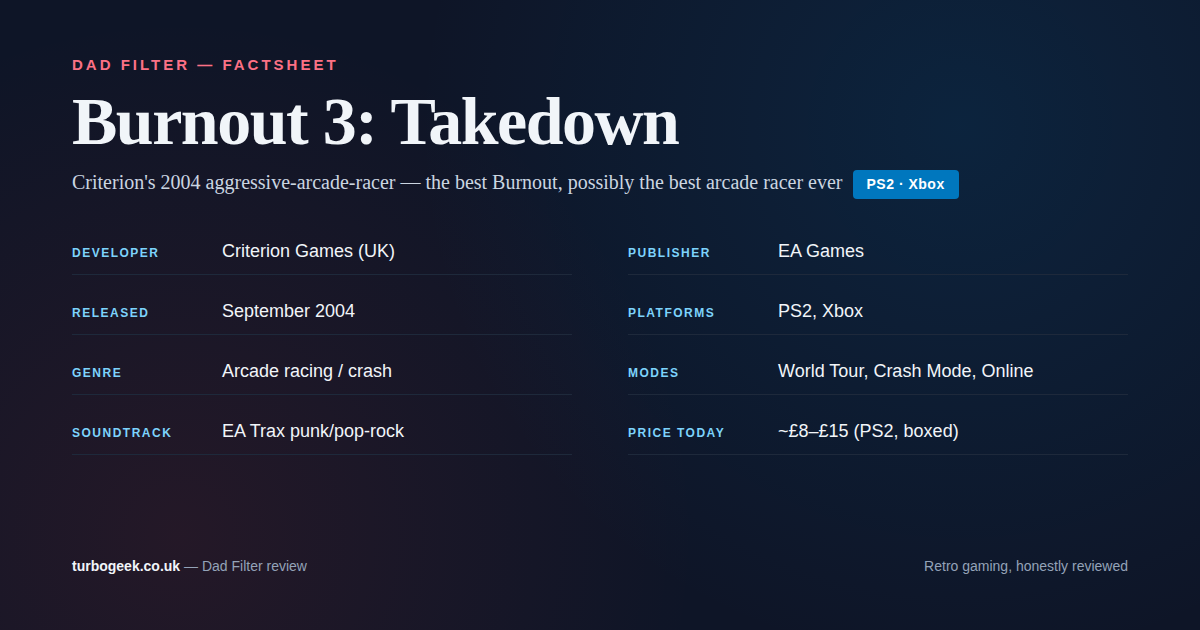
Burnout 3: Takedown on PS2: A Dad’s Return to Criterion’s 2004 Peak
Revisiting Criterion’s 2004 Burnout 3: Takedown on PS2. Aggressive arcade racing, Crash Mode, EA Trax. Still the benchmark arcade racer twenty years on. Read the guide
-

authd in Ubuntu 26.04: Why Cloud Login on Linux Suddenly Matters
Ubuntu 26.04 establishes authd as the supported framework for cloud authentication on Ubuntu. That matters because Linux desktops and servers have lagged cloud identity expectations for years. Read the guide